Alpha Blood results, Panela connects a blood count with its history. Panela+ brings specimen changes, analyzer patterns and QC evidence into one laboratory review.
Synthetic examples. Research review, not diagnosis.
How it works
Look across the panel. Explore the cells behind a complete blood count.
Red cells carry oxygen through the body.
White cells help defend against infection.
Platelets are small fragments that help stop bleeding.
Read the blood Red cells, white cells and platelets belong to one panel. Panela explores relationships across them.
Whole panel Red cells White cells Platelets Connections
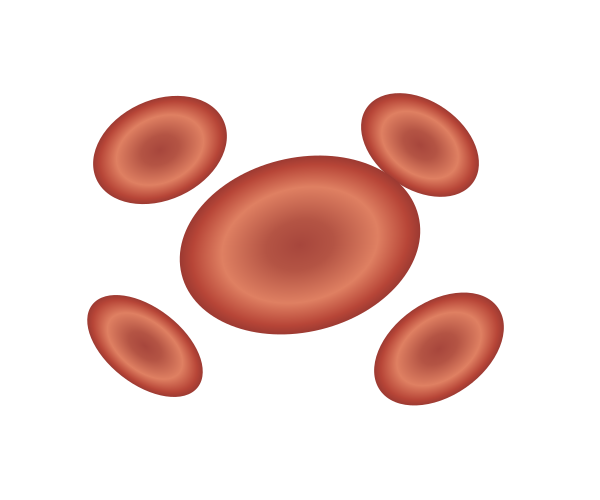
Illustrative blood components.
Panela Start with the report. Import a PDF, scan or table in the partner alpha. Review extracted values and units before analysis.
Panela Read beyond A blood count describes connected cell populations. Hemoglobin, cell size and variation help explain a pattern together.
Panela Add the context. See hemoglobin, cell size and cell-size variation against the example reference intervals.
Range colors show distance. Review rules set the number.
Hemoglobin MCV RDW
Panela A review priority, The highest applicable CBC review rule sets the 1–5 number. Related indices support one finding; they are not added as separate votes.
Missing essential data withholds the number. The scale is unvalidated and is not a disease probability.
Panela From the panel Export a concise PDF with priority, connected values and next considerations. Source results and units stay attached.
Panela+ Now look across Panela+ connects specimens, patient histories, analyzer patterns and recorded QC events in one review workspace.
Panela+ What changed Follow the earlier specimens. A shared decrease across counts prompts one investigation, while the original values remain visible.
Panela+ One specimen, Follow the analyzer signal, then look closer at the change.
Inspect graph Panela+ Bring the evidence
CBC measurements across three collections
Illustrative history. Three small multiples use identical earlier, previous and current x positions and the same index scale, with each earlier value set to 100. Hemoglobin: 13.8, 13.4 and 8.28 g/dL. White blood cells: 6.4, 6.1 and 3.84 ×10³/µL. Platelets: 260, 252 and 156 ×10³/µL. Each current measurement is 60 percent of its earlier value. Printed point labels show the actual measurements.
Index, earlier = 100
Point labels show measured values
Hemoglobin
Hb, g/dL
100
60
13.8
13.4
8.28
White blood cells
WBC, ×10³/µL
100
60
6.4
6.1
3.84
Platelets
PLT, ×10³/µL
100
60
260
252
156
Earlier Previous Current
CBC measurements across three collections
Illustrative history. Three stacked charts share x positions for earlier, previous and current, and the same 40 to 110 index scale with earlier set to 100. Hemoglobin: 13.8, 13.4, 8.28 g/dL. White blood cells: 6.4, 6.1, 3.84 ×10³/µL. Platelets: 260, 252, 156 ×10³/µL. Point labels show actual measurements. Each current value is 60 percent of its earlier value.
Hemoglobin, g/dL
100 60 13.8 13.4 8.28
White blood cells, ×10³/µL
100 60 6.4 6.1 3.84
Platelets, ×10³/µL
100 60 260 252 156
Earlier Previous Current
Index, earlier = 100
Illustrative patient history.
Panela+
A sudden shift. Back to analyzer
Median hemoglobin across illustrative sample windows
Twenty illustrative sample windows contain ten symmetrically offset hemoglobin results each. Their medians in g/dL are 13.8, 13.7, 13.9, 13.8, 13.7, 13.9, 13.8, 13.7, 13.9, 13.8, 15.6, 15.8, 15.9, 16.0, 15.8, 15.9, 15.7, 15.9, 15.8, 15.9. The y-axis runs from 12 to 17 g/dL. The increase starts at sample window 11. A possible-QC-issue marker at zero-based index 12, window 13, prompts review of controls without identifying a confirmed cause.
Median hemoglobin, g/dL
Possible QC issue
Review controls
12 13 14 15 16 17
1 5 10 15 20 Sample window
Median hemoglobin across illustrative sample windows
Twenty illustrative sample windows contain ten symmetrically offset hemoglobin results each. Median hemoglobin values in g/dL are 13.8, 13.7, 13.9, 13.8, 13.7, 13.9, 13.8, 13.7, 13.9, 13.8, 15.6, 15.8, 15.9, 16.0, 15.8, 15.9, 15.7, 15.9, 15.8, 15.9. The y-axis uses the same 12 to 17 g/dL domain as the wide chart. A possible-QC-issue marker at zero-based index 12, window 13, prompts review of controls without identifying a confirmed cause.
Possible QC issue
Review controls
Median hemoglobin, g/dL
12 13 14 15 16 17 1 5 10 15 20 Sample window
Illustrative sample windows.
Import Cells Context Priority Export Panela+ History Analyzer Case
Panela Review a synthetic blood report, its connected findings and an example report.
Open CBC demo Panela+ Trace a specimen change or analyzer pattern through its supporting evidence.
Open laboratory demo Methods and limits The 1–5 review scale is an unvalidated research policy. Separate model studies report their own targets, cohorts and results; they do not validate diagnosis or urgency.
Study and sources Evaluate with your team. Start with synthetic cases and a defined review question. Full imports and desktop access are shared through a private partner evaluation.
Partner evaluation  ExAnte